
In this last article of our current MetOps series, Mike Duffy gives us a practical guide to getting started with MetOps and looks at some of his preferred tools of the trade.
The term ‘MetOps’ is used to describe the bringing together of people, processes and tools within a modern business environment. The aim is to deliver the same benefits to monitoring, as DevOps has to operations and development. MetOps is not only intended to encompass technical elements such as servers and services, but also business data such as sales and finance.
In an ideal world, poor quality code releases which damage the customer experience should be easy to correlate with a drop in sales… Each of these things is an event or a metric. In a MetOps focused organisation these become valuable indicators, allowing developers and business people to alert and predict on issues before they become catastrophic.
In part one of this series, we laid out the foundations of the MetOps approach and examined the many benefits it can bring to an organisation. It covered the basic philosophy and some of the approaches to implementing MetOps in an existing business.
In part two we looked at how we could integrate MetOps into existing teams and leverage the business and technical skills that are already present. MetOps is a unifying approach that should have participation across a wide spectrum of departments and skill sets.
Those articles lead us to nicely to part three, the tools you can use to implement the MetOps maturity model. The MetOps maturity model is a loose set of stages that you can use to both gauge your current monitoring capabilities whilst planning for future tooling and processes.
The MetOps Stages
The four stages of MetOps are designed to guide an organisation through implementing a holistic monitoring regime, from simple first steps of state monitoring through to predictive alerting and forecasting at the top end. You can see the four stages in below figure.
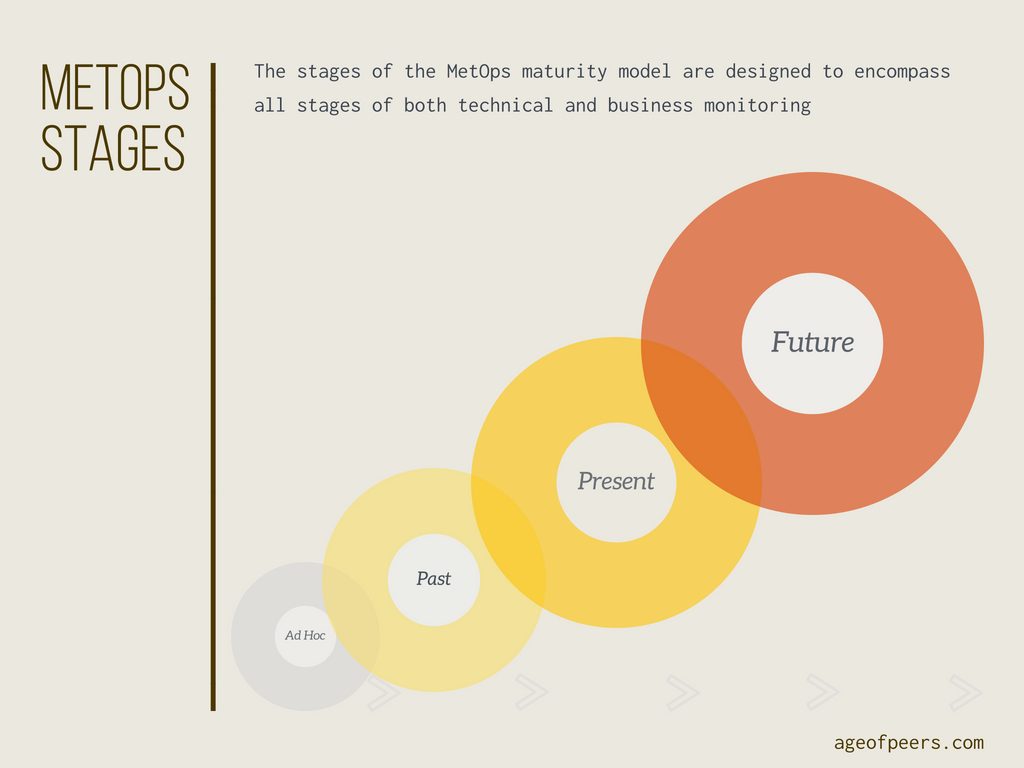
1. Ad Hoc
Ad Hoc monitoring is where many teams find themselves, with alarms and alerts triggered when pre-set thresholds are reached. Monitoring is sparse, and only covers the essential systemic items such as CPU, RAM and disk space.
2. Past
This level refers to alerting on issues that have already occurred, and entails having both threshold alarms and log analysis. At this level of maturity it allows for more in-depth analysis of alerts created by stage one tools, as well as giving insight into the underlying platform activity.
3. Present
At this stage of the maturity stack, you have threshold, log and metric analysis. Metric gathering encompasses not only systemic items, but also business events such as API/Page requests per second, orders taken and other metrics that are key indicators of business health.
4. Future
At stage four you are taking the product of the first three stages and using techniques such as Machine Learning (ML) to process the outputs of your monitoring. Machine learning allows the creation of predictive alarms that track trends and patterns instead of requiring the setting of hard limits and thresholds.
The MetOps maturity model allows us to set our ambitions and to state our current position. We can also combine it with the four pillars of monitoring, allowing us to focus on which stage of the maturity model a particular set of tooling fits.
The Four Pillars of Monitoring
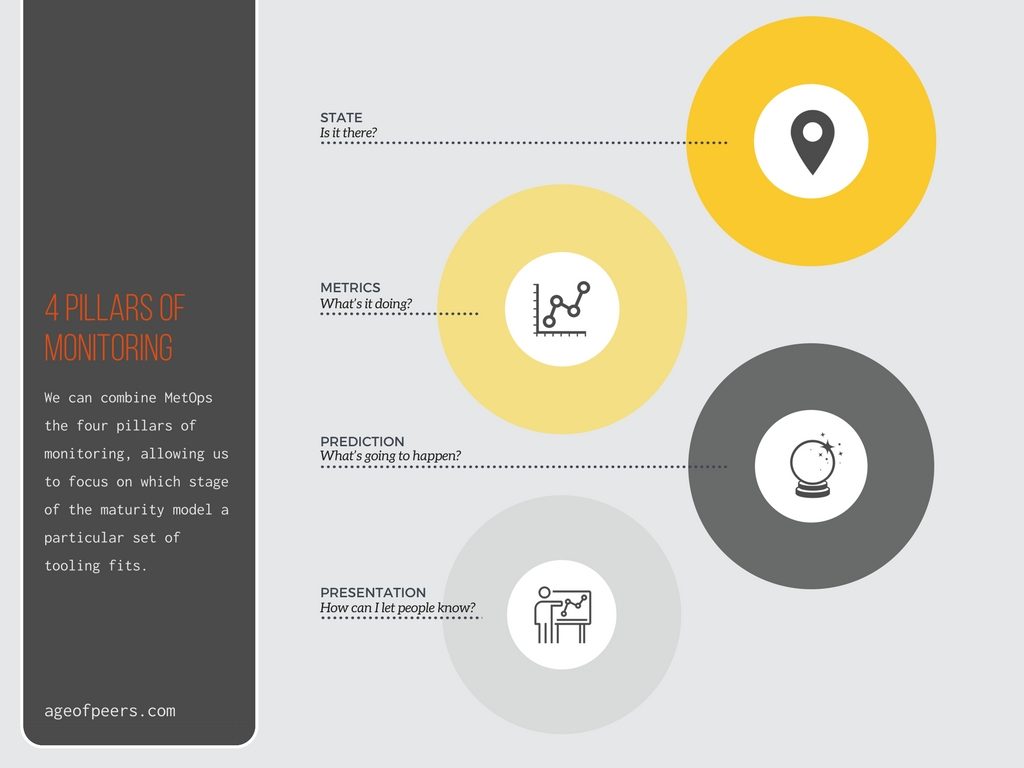
As you can see, this maps nicely to the MetOps maturity model. So now we are up to speed with the MetOps maturity model, what tools can we use to implement it?
Robust and Powerful State Alerting
Stage one is probably the most crowded market for both commercial and Open Source tools. State monitoring is the most basic form of monitoring and has been around since the dawn of computing. Most DevOps engineers will be familiar with tools such as Zabbix and Icinga, both of which are forks from the venerable Nagios project. However, modern alternatives are starting to arrive which scale better and offer more in-depth integration into a modern software stack. Two excellent tools at this level are Sensu or Elastic Metric Beats.
Sensu is a commercial Open Source project. Its key selling point is ease of installation and scalability. Based on a message queue, Sensu allows clients to subscribe to checks rather then each host having to be assigned them individually. Once the checks have been executed on the host, the results are placed back on the queue for consumption by a master. By using a message queue architecture Sensu allows for massive scale without needing massive infrastructure.
Elastic offers similar functionality by using a combination of Metric, File and Command beats. Combining these three beats modules delivers a rich set of data that can be queried and alerted on. Through a combination of clustering and using indexing nodes, Elastic is also relatively straightforward to manage at scale. Although it lacks the elegance of the message queue oriented architecture, Elastic makes up in part by being exceptionally easy to deploy and scale. Elastic has built-in clustering, meaning that adding additional master nodes is extremely simple.
Using either of these tools will allow you to build a robust and powerful state alerting system which warns you when services or resources pass a pre-set threshold. Although not the most sophisticated approach, it is the basis for reliable monitoring that generates for an alert if there is a service outage.
Analyzing logs and event streams
Now that you have state monitoring, you can turn your attention to log and event stream monitoring. At present most organisations turn to either Elastic or Splunk for this functionality. Elastic is not the only Open Source option, there are excellent alternatives such as Graylog. However, they lack the rich feature set that both Splunk or Elastic offer. If you have already used Elastic to fulfil the first stage of the MetOps maturity model then you can leverage the investment in time and effort to reuse the existing alarms and dashboards. It also allows re-use of the existing infrastructure and skills from implementing it for state monitoring.
For some organisations offerings such as DataDog can be compelling, but these rely on the ability from a corporate governance perspective to ship potentially sensitive data off-site. With the advent of the General Data Protection Regulation (GDPR) this may mean that they are unsuitable, or may require additional expense to ensure that data is held in GDPR compliant regions.
Once in place, a log monitoring tool allows for robust monitoring and alerting, especially if you invest development time to ensure that log file hygiene is of a high standard (Only logging essential elements in a common layout, preferably into a structured format such as JSON).
The Power of Time Series data
Stage three is where we fully utilise the power of metrics. The market for time series databases is fast growing, and entrants such as Influx and Prometheus have released compelling and powerful solutions. Not wanting to be left behind, Elastic too have joined the fray with the release of Metric Beats. Each of these tools has some exciting features, and importantly, are easy to integrate with. A metrics system is of little use if no one can bring themselves to actually populate it. Each of these solutions ship with many tools that allow easy importing of data, be it system stats or custom metrics. Each has a reasonably intuitive GUI allowing the exploration and charting of the data, allowing semi-technical users the ability to create custom dashboards and alerts.
The primary competitors to these solutions are cloud offerings such as AWS Cloud Watch. However, Cloud Watch is reliant on shipping data outside of the corporate environs. Although AWS is ISO 27001 and GDPR compliant (Depending on region), recent scares such as Spectre and Meltdown have called into question the security of public clouds for the more security-focused entities.
Anomaly Detection
At stage four of the MetOps maturity model, you should have a complete picture of your infrastructure and receive timely alerts when anything goes wrong. The next step is to start predicting issues before they occur. To achieve this, you need some form of anomaly detection. Anomaly detection is the ability to take existing data and mine it for patterns and trends. Once established anything that falls outside of these patterns can be judged to be anomalous and therefore something to make visible and alert on.
Anomaly detection is in its infancy. Some promising Open Source projects are starting to surface such as Twitter’s AnomalyDetection project, but as yet none have gained significant traction. Elastic has taken the lead in this space with its Machine Learning component. Built into the Elastic X-pack, it is an ever-present monitor that tracks available metrics and intelligently builds up patterns. Once it understands these patterns, it surfaces them as actionable alerts.
. . .
Hopefully, this has given you a taster of the tools that are available to allow you to start implementing a MetOps practice within your organisation. Using any of these tools or their alternatives you can build a comprehensive monitoring platform that can collect, display, learn and alert on your essential business data. By bringing monitoring back into the technical teams, you both massively improve the quality of your monitoring and your ability to act on them.
And if nothing else, you can put up a huge TV in the office and admire the kaleidoscope of colourful graphs.
Featured Photo by Adam Sherez on Unsplash